NEWS AND INSIGHTS | MARKET COMMENTARY
Return of the Headlines
February 06, 2025

Bouts of volatility and shifts in market dynamics highlight the importance of portfolio diversification across asset class, style and sector, and the value of active portfolio management, especially in less-efficient areas of the market.
The new year started off like a reset button for markets. December had been a weaker, more volatile month after the FOMC signaled a more cautious path ahead for monetary policy, and so, various positive data points in January were greeted positively. Slightly cooler core inflation came as a relief while the labor market remained firm, quieting whispers regarding the need for a rate hike in the next few quarters. This was further confirmed when the Federal Reserve held interest rates steady during its January meeting, with the latest “Fed-speak” signaling the need for patience given a somewhat uncertain macro backdrop. The next FOMC meeting is slated for March, and as it stands, markets are pricing in around an 80% chance of rates remaining unchanged again.
Meanwhile, the earnings season started out strong with some of the large banks beating estimates and raising 2025 guidance on key measures like net interest income. Big tech earnings showed mixed results: Microsoft and Tesla fell short of expectations, while Meta and Apple both exceeded them. Causes for potential concern included weakness in Microsoft’s cloud business (Azure), which could have broader implications for companies like Alphabet and Amazon, and Apple’s slow iPhone sales in China, in part due to growing domestic competition.
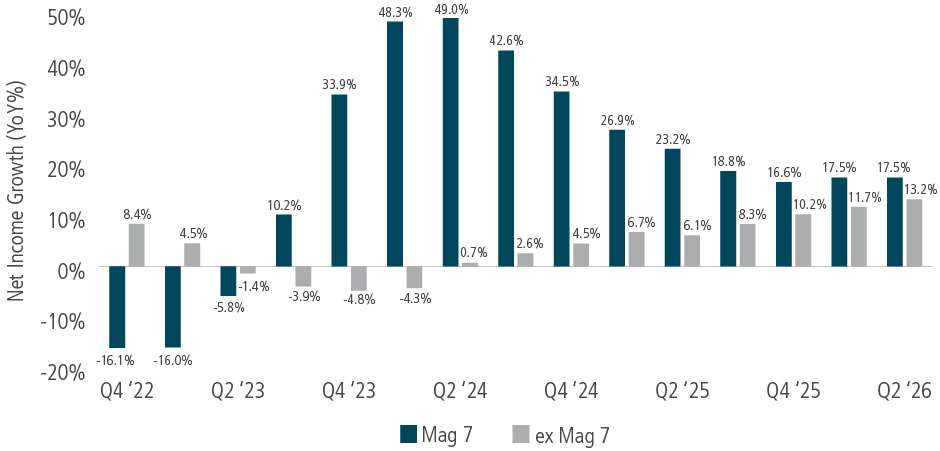
Still, the earnings gap between big tech and the rest of the market remains meaningful, but is expected to tighten. Estimated earnings growth for the “Magnificent 7” stocks was 22% year-over-year in the fourth quarter, with that basket of stocks having beat expectations for seven quarters in a row. Meanwhile, the S&P 500 ex-Mag 7 is expected to grow only 5% year-over-year. As of the end of the month, 36% of S&P 500 companies had reported earnings with a blended growth rate of 13.2%, which is better than initial estimate of around 12%. If 13.2% is the actual growth rate, it would mark the highest year-over-year earnings growth rate for the index since 4Q 2021.
Source: Bloomberg as of February 4, 2025
In the political sphere, the inauguration of President Donald Trump dominated the headlines during the month, with a litany of executive orders occurring on the first day of his term. One announcement of significance was “Stargate,” an artificial intelligence infrastructure project backed by OpenAI, Oracle and Softbank, with key technology partners including Arm Holdings, Microsoft and Nvidia, that looks to invest $500 billion over four years. The goal of the project is to ensure that the U.S. remains a global leader in the future of AI. These new pieces of information out of the White House ultimately led stocks higher, although not without some volatility, with the S&P 500 hitting a fresh all-time high of 6,118 on January 23.
Only a few days after the all-time high, however, news broke in the realm of AI that countered prevailing sentiment and resulted in sudden, dramatic moves in the marketplace. DeepSeek, an AI startup based in China, announced that it had developed a more cost-effective way to train its models—and did so with a much smaller budget and less resources than its major competitors—which rattled U.S.-based semiconductor stocks and sent shockwaves across the broader domestic equity market. Nvidia’s stock price fell 17% in a single session and dragged the broader index down with it, resulting in declines of 1.5% for the S&P 500 and 3.1% for the Nasdaq Composite.
The immediate shock was tempered by further insights, including reports that DeepSeek’s technology may be more reliant on Nvidia chips than first signaled. However, we believe there is a larger takeaway: that there will likely be more scrutiny around AI spending going forward, and potentially greater volatility, as investors adapt to innovation in the space. We believe investors should keep this in mind and adjust expectations regarding some of the big winners of the past few years, especially given their historically high valuations. The good news is that, as mentioned in our Solving for 2025 publication, the stage is set for a broadening of equity market performance beyond the mega-cap technology stocks. In addition, Trump announced his plan for tariffs on goods imported from Canada and Mexico (25%), and China (10%) to begin in February. Despite a delay in implementation as to Mexico and Canada following negotiations with Mexican President Claudia Sheinbaum and Canadian Prime Minister Justin Trudeau, the trade situation remains uncertain and somewhat volatile, with further product-specific tariffs on pharmaceuticals, chips and industrial metals—as well as broader tariffs on the European Union—still on the table. Additionally, China announced retaliatory tariffs on U.S. imports including coal and liquified natural gas. The consensus is that tariffs may cause some near-term volatility that could weigh on markets, but as of now, we are not anticipating a significant hit to U.S. growth or a persistent increase in inflation to result from these actions.
There have been signs of broadening so far in 2025. Despite headline volatility, the S&P 500 ended the month higher (+2.8%), even as the Information Technology sector moved lower (-2.9%). The Magnificent 7 stocks, which have buoyed index returns for the last two years, detracted in January (-0.12% as a basket of stocks). Meanwhile, Communication Services (+9.1%), Health Care (+6.8%) and Financials (+6.6%) were the top contributors to the index. The equal-weighted S&P 500 also outperformed the market-cap-weighted index in January, returning +3.5% vs +2.8%. While one month of returns are not necessarily an indication of how the rest of the year will unfold, in our view, the economic picture, coupled with expected deregulation and business-friendly policies, has created a firmer foundation to make the rotation more sustainable. Some key takeaways from bouts of volatility and shifts in market dynamics are the importance of portfolio diversification across asset class, style and sector; and the value of active portfolio management, especially in less-efficient areas of the market.
Equities moved broadly higher in January, with the equal-weighted S&P 500 outperforming market-cap weighted, showing signs of broadening performance. We maintain an at-target view across equities with an overweight to small- and mid-caps as we anticipate the broadening to continue. For non-U.S. markets, we have been more cautious about extending the broadening thesis. Short-term volatility related to tariffs may warrant some rebalancing, for example, from large/mega-cap tech to small-cap stocks. However, any larger pullbacks (5% or more) could be an appropriate trigger to add to risk, especially if one is holding excess cash. In this more challenging environment, we favor employing active management to select companies with high earnings visibility.
Fixed Income saw positive returns across the board during the month, with high yield the strongest. We are more constructive on investment grade fixed income as yields are close to fair value, with shorter-dated bonds in particular presenting little downside risk, in our opinion. With the spread of bond yields over cash rates likely to widen further, we see opportunities to deploy cash tactically, adding duration based on where rates are. Multi-sector bond funds may be an appropriate vehicle to consider, given the levers a manager can opportunistically pull across sector, duration profile, region, etc. Overall, our soft-landing outlook and debt sustainability concerns make us cautious on longer-dated bonds, even if policy rates are cut in the latter half of the year.
With the liquidity drought fading and an expected pickup in M&A and other deal activity due to a healthy macro backdrop, we believe significant opportunities still exist within Private Markets, as investors should expect new buyout activity and an unlocking of distributions. That said, liquidity and capital solutions providers will remain important to work through the substantial backlog of legacy investments. As a result, we continue to see compelling opportunities across secondaries, mid-life co-investments, and capital solutions. We are cautious on core private real estate, but this is offset by what we see as abundant market-dislocation opportunities in the value-add and opportunistic sectors and particularly in real estate secondaries. Neuberger Berman’s deep relationships and unique position within the private equity ecosystem have translated into record levels of deal flow across our platform.
| 1M | 3M | YTD | |
|---|---|---|---|
| Equities & FX | |||
| Major U.S. Indices | |||
| S&P 500 Index | 2.8% | 6.2% | 2.8% |
| Nasdaq Composite | 1.7% | 8.7% | 1.7% |
| Dow Jones | 4.8% | 7.1% | 4.8% |
| U.S. Size Indices | |||
| Large Cap | 3.2% | 6.8% | 3.2% |
| Mid Cap | 4.3% | 5.5% | 4.3% |
| Small Cap | 2.6% | 4.5% | 2.6% |
| All Cap | 3.2% | 6.7% | 3.2% |
| U.S. Style Indices | |||
| All Cap Growth | 3.2% | 6.7% | 3.2% |
| All Cap Value | 4.5% | 3.6% | 4.5% |
| Global Equity Indices | |||
| ACWI | 3.4% | 4.7% | 3.4% |
| ACWI ex US | 4.0% | 1.1% | 4.0% |
| DM Non-U.S. Equities | 5.3% | 2.3% | 5.3% |
| EM Equities | 1.8% | -1.9% | 1.8% |
| Portfolios | |||
| 50/50 Portfolio | 1.6% | 3.5% | 1.6% |
| 1M | 3M | YTD | |
|---|---|---|---|
| Fixed Income & Commodities | |||
| Major U.S. Indices | |||
| Cash | 0.4% | 1.2% | 0.4% |
| U.S. Aggregate | 0.5% | -0.1% | 0.5% |
| Munis | 0.5% | 0.7% | 0.5% |
| U.S. Corporates | |||
| Investment Grade | 0.6% | -0.1% | 0.6% |
| High Yield | 1.3% | 1.9% | 1.3% |
| Short Duration (1.9 Yrs) | 0.5% | 1.0% | 0.5% |
| Long Duration (12.8 Yrs) | 0.4% | -2.4% | 0.4% |
| Global Fixed Income Indices | |||
| Global Aggregate | 0.6% | -1.3% | 0.6% |
| EMD Corporates | 0.8% | 0.8% | 0.8% |
| Commodities | |||
| Commodities | 4.0% | 5.4% | 4.0% |
| U.S. Treasury Yields | |||
| U.S. 10-Year Yield | 0.0% | 0.3% | 0.0% |
| U.S. 2-Year Yield | 0.0% | 0.0% | 0.0% |
| FX | |||
| U.S. Dollar | -0.1% | 4.2% | -0.1% |
Source: Bloomberg, total returns as of January 31, 2025. S&P 500 Index is represented by S&P 500 Total Return Index. Nasdaq Composite NASDAQ-Composite Total Return Index. Dow Jones is represented by Dow Jones Industrial Average TR. Large Cap is represented by Russell 1000 Total Return Index. Mid Cap is represented by Russell Midcap Index Total Return. Small Cap is represented by Russell 2000 Total Return Index. All Cap is represented by Russell 3000 Total Return Index. Large Cap Growth is represented by Russell 1000 Growth Total Return. Large Cap Value is represented by Russell 1000 Value Index Total Return. Small Cap Growth is represented by Russell 2000 Growth Total Return. Small Cap Value is represented by Russell 2000 Value Total Return. ACWI is represented by MSCI ACWI Net Total Return USD Index. ACWI ex US is represented by MSCI ACWI ex USA Net Total Return USD Index. DM Non-U.S. Equities is represented by MSCI Daily TR Gross EAFE USD. EM Equities is represented by MSCI Daily TR Gross EM USD. Cash is represented by ICE BofA US 3-Month Treasury Bill Index. U.S. Aggregate is represented by Bloomberg US Agg Total Return Value Unhedged USD. Munis is represented by Bloomberg Municipal Bond Index Total Return Index Value Unhedged USD. Munis Short Duration is represented by Bloomberg Municipal Bond: Muni Short (1-5) Total Return Unhedged USD. Munis Intermediate Duration is represented by Bloomberg Municipal Bond: Muni Intermediate (5-10) TR Unhedged USD. Investment Grade is represented by Bloomberg US Corporate Total Return Value Unhedged USD. High Yield is represented by Bloomberg US High Yield BB/B 2% Issuer Cap Total Return Index Value Unhedged USD. Short Duration is represented by Bloomberg US Agg 1-3 Year Total Return Value Unhedged USD. Long Duration is represented by Bloomberg US Agg 10+ Year Total Return Value Unhedged USD. Global Aggregate is represented by Bloomberg Global-Aggregate Total Return Index Value Unhedged USD. EMD Corporates is represented by J.P. Morgan Corporate EMBI Diversified Composite Index Level. EMD Sovereigns – USD is represented by J.P. Morgan EMBI Global Diversified Composite. Commodities is represented by Bloomberg Commodity Index Total Return. Commodities ex Energy is represented by Bloomberg Ex-Energy Subindex Total Return. U.S. 10-Year Yield is represented by US Generic Govt 10 Yr.
IMPORTANT INFORMATION:
This material is provided for informational and educational purposes only and nothing herein constitutes investment, legal, accounting or tax advice, or a recommendation to buy, sell or hold a security. This material is general in nature and is not directed to any category of investors and should not be regarded as individualized, a recommendation, investment advice or a suggestion to engage in or refrain from any investment-related course of action. Neither Neuberger Berman nor its employees provide tax or legal advice. All information is current as of the date of this material and is subject to change without notice. The firm, its employees and advisory accounts may hold positions of any companies discussed. Any views or opinions expressed may not reflect those of the firm as a whole. Neuberger Berman products and services may not be available in all jurisdictions or to all client types. Diversification does not guarantee profit or protect against loss in declining markets. Investments in private equity are speculative and involve a higher degree of risk than more traditional investments. Investments in private equity are intended for sophisticated investors only. Unless otherwise indicated, returns shown reflect reinvestment of dividends and distributions. Indexes are unmanaged and are not available for direct investment. Investing entails risks, including possible loss of principal. Past performance is no guarantee of future results.
Portfolio positioning views expressed herein are those of Neuberger Berman’s Private Wealth Investment Group which may include those of the Neuberger Berman’s Asset Allocation Committee. Asset allocation and positioning views are based on a hypothetical reference portfolio. The Private Wealth Investment Group analyzes market and economic indicators to develop asset allocation strategies. The Private Wealth Investment Group works in partnership with the Office of the CIO. The Private Wealth Investment Group also consults regularly with portfolio managers and investment officers across the firm. The Asset Allocation Committee is comprised of professionals across multiple disciplines, including equity and fixed income strategists and portfolio managers. The Asset Allocation Committee reviews and sets long-term asset allocation models, establishes preferred near-term tactical asset class allocations and, upon request, reviews asset allocations for large, diversified mandates. Asset Allocation Committee members are polled on asset classes and the positional views are representative of an Asset Allocation Committee consensus. The views of the Asset Allocation Committee and the Private Wealth Investment Group may not reflect the views of the firm as a whole and Neuberger Berman advisers and portfolio managers may take contrary positions to the views of the Asset Allocation Committee or the Private Wealth Investment Group. The Asset Allocation Committee and the Private Wealth Investment Group views do not constitute a prediction or projection of future events or future market behavior. Defensive positioning generally means an underweight bias on allocations to risk assets such as equities and alternatives. Positioning views may change over time without notice and actual client positioning may vary significantly. Discussion of yield characteristics or total returns of different asset classes are for illustrative purposes only. Such asset classes, such as equities and fixed income, may have significantly different overall risk-return characteristics which should be consider before investing.
The information in this material may contain projections, market outlooks or other forward-looking statements regarding future events, including economic, asset class and market outlooks or expectations, and is only current as of the date indicated. There is no assurance that such events, outlook and expectations will be achieved, and actual results may be significantly different than that shown here. The duration and characteristics of past market/economic cycles and market behavior, including any bull/bear markets, is no indication of the duration and characteristics of any current or future be market/economic cycles or behavior. Information on historical observations about asset or sub-asset classes is not intended to represent or predict future events. Historical trends do not imply, forecast or guarantee future results. Information is based on current views and market conditions, which will fluctuate and may be superseded by subsequent market events or for other reasons.
Discussions of any specific sectors and companies are for informational purposes only. This material is not intended as a formal research report and should not be relied upon as a basis for making an investment decision. The firm, its employees and advisory accounts may hold positions of any companies discussed. Nothing herein constitutes a recommendation to buy, sell or hold a security. It should not be assumed that any investments in securities, companies, sectors or markets identified and described were or will be profitable. Investment decisions and the appropriateness of this content should be made based on an investor's individual objectives and circumstances and in consultation with his or her advisors.
Neuberger Berman Investment Advisers LLC is a registered investment adviser.
The “Neuberger Berman” name and logo are registered service marks of Neuberger Berman Group LLC.